Sydur Rahman and Bedirhan Tarhan
Let’s start with some epidemiology. Below are lifetime prevalence values in the general population for four commonly diagnosed conditions in psychiatry.
| Condition | Estimated Lifetime Prevalence |
| Schizophrenia | 0.3-0.7% |
| Schizoaffective Disorder | ~0.3% |
| Bipolar I Disorder | 0.6% |
| Bipolar II Disorder | 0.4% |
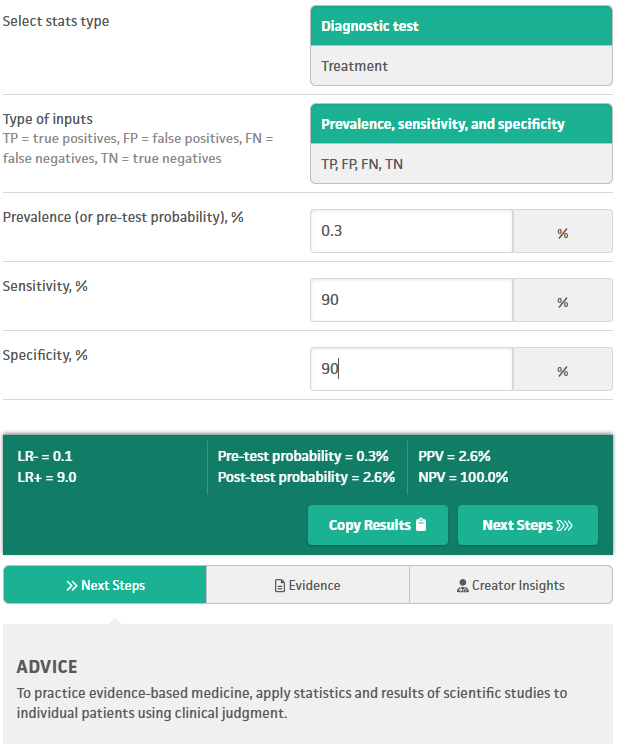
We will apply Bayes’ theorem to lifetime prevalence, under different conditions.
For anyone who is concerned about the base rates in the table:
No psychiatric setting has a rigorously derived, methodologically sound lifetime prevalence estimate for these conditions, and no one has ever published such a study.
When no setting‑specific, methodologically sound lifetime prevalence exists—and it does not for psychiatric inpatient units, residential programs, IOP, PHP, or outpatient clinics—the only defensible prior [probability] is the general‑population lifetime prevalence. Anything else is guesswork dressed up as “clinical intuition.”
The general population figures in the opening table are not casual estimates. They came from:
• Representative sampling
• Structured diagnostic interviews
• Medical rule‑outs incorporated into methodology
• Longitudinal correction for diagnostic drift
That is the gold standard. Everything else is selection bias, referral bias, and diagnostic momentum masquerading as true epidemiology. Clinicians often push back because the general‑population base rate “feels wrong” in a high‑acuity setting. But Bayes theorem does not care about vibes; this is not a criticism of clinicians—it is a property of mathematical probability. If you do not have a rigorously derived setting‑specific prevalence, you do not get to invent one yourself. We anchor to the best data we have.
Something else I remind clinicians is: diagnoses of exclusion require clinicians to rule out medical causes and contributors, which rarely happens in adults diagnosed with schizophrenia, schizoaffective disorder, bipolar I disorder, and bipolar II disorder. Countless patients do not get the studies that would increase their diagnosticians’ sensitivity and specificity (e.g. bloodwork, urine studies, head imaging, +/-CSF studies, etc.). Sometimes even a simple drug screen is not done. We cannot grant a diagnosis of exclusion without actually making exclusions.
Once we acknowledge that medical rule‑outs are rarely performed, the next question becomes: even if clinicians were diagnostically impeccable, what would the math allow? If we temporarily set aside the real-world problem of inadequate medical rule-outs, the math alone still constrains what is diagnostically possible.
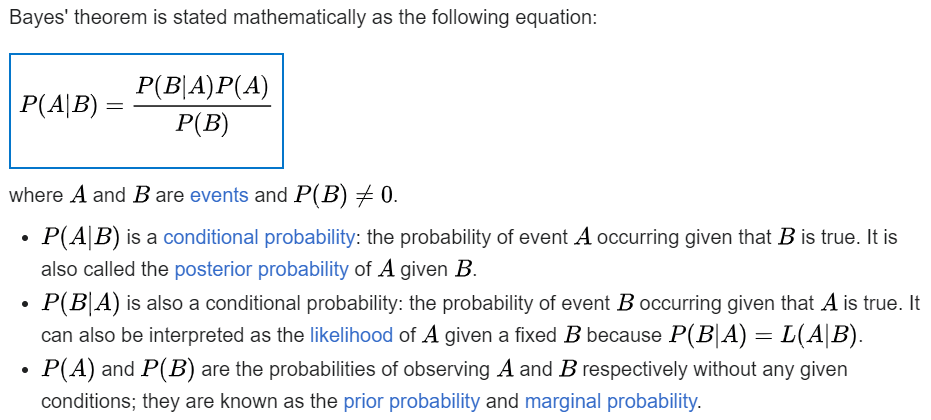
Imagine a fantasy world where psychiatrists have near perfect sensitivity and specificity (both 99%) for schizoaffective disorder. Positive predictive value (PPV) is the probability that a person who tests “positive” actually has the condition under consideration. PPV is the only number that answers the question: “If I diagnose this, how likely is it to be true?”
The psychiatrist’s evaluation is the “Diagnostic test” in the image below. In our fantasy world, even evaluations with near perfect sensitivity and specificity (99/99) for schizoaffective disorder yield a positive predictive value (PPV) of only 23%. Since PPV is 23%, the remaining 77% are false positives, otherwise known as misdiagnoses. So even the fantasy collapses under the weight of a low base rate.
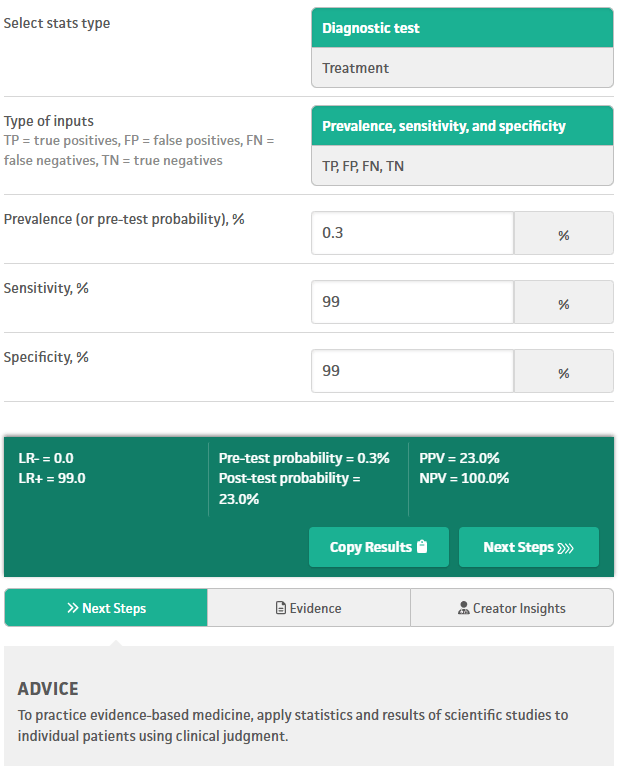
Now consider a less fantastical scenario, but still extremely unlikely in the real world: evaluations with 90% sensitivity and 90% specificity for schizoaffective disorder:
Here the positive predictive value is only 2.6%, so 97.4% of “positive” evaluation results are false positives (misdiagnoses of this disorder).
Next consider more realistic (but still ambitious) numbers for sensitivity and specificity, over the course of multiple independent evaluations. Clinicians often assume that multiple evaluations “stack” toward certainty, but the math does not agree. For a condition with a base rate of 0.3% (e.g. schizoaffective disorder), even after 5 independent and positive evaluations, each with 70% sensitivity and 70% specificity, the final PPV is only ~17%. Therefore 83% are false positives (misdiagnoses).
The 17% PPV is actually a best-case scenario here, under fantasy conditions of independence specifically. Real-world PPV is even lower. A single clinician cannot perform mathematically independent evaluations, and clinicians who share information about a patient are not performing mathematically independent evaluations either. Mathematically, dependence always lowers PPV, never raises it. Dependence lowers PPV because shared information amplifies shared errors.
In any case, we simply cannot outskill the math. Since no psychiatrist, or psychiatric NP, or psychologist, etc. actually attains 90-99% sensitivity and specificity in their evaluations, and they do not perform serial evaluations that are mathematically independent, a great majority of low-base-rate diagnoses in psychiatry are false positives – misdiagnoses. We can repeat these calculations for any of the conditions in the table above. All of the above calculations are straightforward to reproduce with any Bayesian calculator. Here is the one I used: https://www.mdcalc.com/calc/3993/basic-statistics-calc
Moral of the story: a low base rate for a condition crushes the positive predictive value of any test or evaluation that “diagnoses” that condition, especially in psychiatry where sensitivity and specificity are limited by multiple real world factors. Every condition in the opening table has a low enough base rate to suffer that collapse of PPV. When the base rate is that low, no amount of clinical experience, intuition, or repetition can rescue the PPV. Unfortunately the math collapses predictably. Psychiatric misdiagnosis is not a moral failure—it is a mathematical inevitability for low base rate conditions, unless we change how we diagnose.
